

Level of analysis: Mainly macro, can be applied to meso-level in some cases depending on the level of detail of available data and purpose of assessment.
Assessed aspects of sustainability: Economic, generally national economic relationships.
Main purpose of the assessment: To understand interdependencies of transactions between national industries/sectors in order to predict effects of a change in one industry on others.
Description of the methodology: IOA is a method that systematically quantifies the mutual interrelationships between various sectors of an economy. The method uses national statistics of intersectorial transactions to construct a detailed statistical picture of the national economy in matrix form. The interdependence among the sectors is described by a set of linear equations expressing the balances between the total input and the aggregate output of each commodity and service produced and consumed over a defined period of time. The effect of an event at any one point is transmitted to the rest of the economy step by step via the chain of transactions that link the whole system together.
Detailed Description
IOA was developed by Wassily Leontief as an effort to combine economic facts (empirical content) and theory (mathematical formulation of problems) to describe the inter-industry relationships typically within a nation or a region. A detailed statistical picture of the system could be achieved thanks to high-speed computers and accumulated large quantities of statistical data, and the IOA formulation by Leontief. IOA has passed from mere academic investigation to application in national economic policy assessment. The European System of Accounts ESA 95 has a standard IO-table format of 75 sectors to annually collect statistical economic information from all member countries. This has become compulsory as of 2002. The adoption of common definitions and common classifications assure a high degree of comparability, although due to the recentness some differences in statistical sources and methods between the EU member countries still occur (EC website, visited 2008).
The structure of IOA: IO-tables
IOA takes advantage of the relatively stable pattern of the flows of goods and services in an economy. National transactions are grouped into major departments or sectors of production, distribution, transportation and consumption. A matrix is set up consisting of rows and columns each representing inputs and outputs to and from a given sector over a certain period of time. The figures in the rows show how the output of each sector of the economy is distributed among the others. On the other hand, the figures in the columns show how each sector obtains inputs from the other sectors. The IO-table thus links each industry to all the others. The table may be developed in as much detail as available data permits and the purpose requires.
Technical coefficients and the static input-output system
Using national accounts as a reference, a matrix of technical coefficients is constructed (Leontief 1986). The physical output of sector i is represented by xi, and xij stands for the amount of product of sector i used as input to sector j. The amount of the product of sector i delivered to the final demand sector if represented by yi. The input coefficient of product of sector i going into sector j is then defined as the quantity of output of sector i consumed by sector j per unit of its total output j, and is given as aij;

The total set of input coefficients gives the structural matrix of the economy. The balance between total output and the individual input of the products to the sectors can be described by a set of n (the number of sectors) linear equations, assuming general equilibrium between supply and demand;
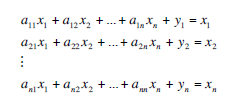
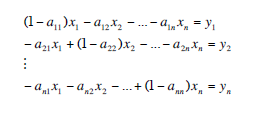
This states that the output of the product of sector j equals the sum of inputs of the product of sector j to all sectors plus final demand yj. This can be reformulated as:
Given the matrix notation;
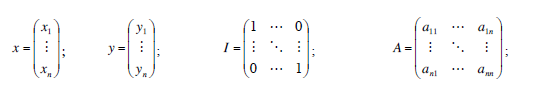
The system of linear equations above can be given in matrix form as;
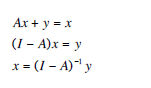
The last equation is the well-known matrix representation of Leontief’s input-output analysis, the Leontief inverse. This can be understood as the amount of inputs needed from each sector to satisfy a given demand of products from one or several sectors, an application known as impact analysis. The column sums of (I – A)-1 are the Leontief multipliers. The multiplier of one specific column provides information about the potential stimulus to the economy if the output of that sector is increased by one unit. Another main application of IO modelling is the imputation of primary inputs, which allows the imputation of labour and capital inputs to final demand.
Social accounting matrices (SAM)
An extension to an IO-table is the Social Accounting Matrix (SAM). In contrast to IO-tables, a SAM is not used for doing imputation studies or impact analysis with Leontief multipliers, but rather restricts to the accounting functions, for a given year and a given region. It is a tableau économique of the macroeconomic structure of sales and purchases, with columns representing buyers and rows representing sellers. The columns and rows distinguished are factors of production (labour, operating surplus), households, companies, government, capital account (savings, investments), production activities (related to domestic transactions), and rest of the world (imports and exports). The focus of the SAM is the distributive aspects of the economy: who pays, who receives. As a SAM is used for revealing the structure rather than for doing modelling, its role in sustainability analysis is restricted to monitoring and benchmarking of developments, not to the analysis of scenarios.
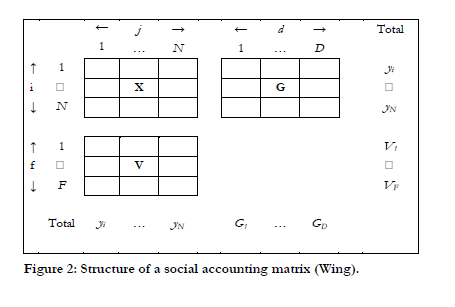
The formulation of a SAM builds on Leontiefs IO-tables. In addition, it considers an unspecified number of households that jointly own an endowment of F different types of primary factors. Three assumptions govern this economy. First, there are no tax or subsidy distortions, or quantitative restrictions on trade. Second, the households act collectively as a single representative agent who rents out the factors to the industries in exchange for income. Households then spend the latter to purchase the N commodities for the purpose of satisfying D types of demands (e.g., demands for goods for the purposes of consumption and investment). Third, each industry behaves as a representative firm that hires inputs of the F primary factors and uses quantities of the N commodities as intermediate inputs to produce a quantity y of its own type of output. Letting the indices i = {1, …, N} denote the set of commodities, j = {1, …, N} the set of industry sectors, f = {1, …, F} the set of primary factors, and d = {1, …, D} the set of final demands, the economic flows in the economy can be completely characterized by three data matrices: an N×N input-output matrix of industries’ uses of commodities as intermediate inputs, denoted by X , an F×N matrix of primary factor inputs to industries, denoted by V, and an N×D matrix of commodity uses by final demand activities, denoted by G.
The elements of the three matrices may be arranged to reflect the logic of the economic flows (table 1). Commodity market clearance implies that the value of gross output of industry i, yi, must equal the sum of the values of the j intermediate uses of that good, xij, and the d dinal demands gid that absorb that commodity. Similarly, factor market clearance implies that the firms in the economy fully employ the representative agent’s endowment of a particular factor, Vf: The assumption that industries make zero profit implies that the values of gross output of sector j, yj, must equal the sum of the benchmark values of inputs of the I intermediate goods xij and f primary factors vff that the industry employs in its production. The representative agent’s income, m, is made up of the receipts from the rental of primary factors and must balance the agent’s gross expenditure of satisfaction of commodity demands. Together, these conditions imply that income must equal the sum of the elements of V, which in turn must equal the sum of the elements of G.
Applications
IOA has been commonly used in national economy planning, but applications have also reached areas such as energy planning (Tia et al 2006), regional analysis (Pietroforte et al 2000), trade issues (Machado et al 2001) etc. IOA can be used for forecasting to some extent, assuming that the main structures between the sectors remain constant over the period analysed. For more robust analysis over time, annual IO-tables can be used in time series, but this has commonly not been done due to the expenses of gathering so many data intensive tables. A widerange of variations exist including the expansion of the model to environmental analysis (see SWOT on Environmental IOA / Extended Environmental IOA).
Strengths
Scope of assessment (what is being assessed)
IOA is relevant from a sustainability point of view in its analysis of macro-level systems, where real quantities of physical flows may be easier to track by looking at monetary transactions. It has strength in its coverage of the entire economic realm of the country or region with a welldefined boundary; there are no significant underestimations of back-ground systems. The method is consistent with an international accounting standard, allowing comparability between countries (if resolutions are similar). IOA also has potential to be integrated with other methods, models and data sources.
Methodology (robustness, validity & reliability)
IOA is a mathematically robust method, and highly based on real empirical data providing reliable results at the macro level, to which it is designed. However, it is methodologically possible to apply IOA to smaller scale systems as well, if relevant data is available. Also the relatively easy and transparent analysis of results is a strength of the method; it is possible to track back results in the calculations and check where specific results arise from.
Weaknesses/Limitations
Scope of assessment
IOA is based on a static accounting system, which makes it less suitable for long term sustainability analysis. It is quite difficult to include consequences of technological change in the system unless a more complex model is built e.g. in time-series. Although the direct effect of one action somewhere in the economy are evaluated in IOA, it is the average effect and not necessarily the real effect, which would be the marginal effect of a change. In IOA the product of a sector is assumed to be homogeneous, when in reality the range of products of a sector can be quite diversified from the aspect of environmental impacts.
IOA also has the problem of data availability and lack of consistency among the available IOtables – differences in sectoral resolution make comparison difficult. Typically it takes one to five years to publish IO-tables based on industry surveys.
Methodology
IOA is based on linear dependencies, giving constant scaling. This can give misleading results the bigger the studied changes or consequences are. One must remember that prices are given in production costs and marginal costs are equal to average costs in this method. Also no price elasticities are included, or consumer behaviour as how a consumer will react to price changes. The model is based on the assumption of general equilibrium. Data collection and model construction may be cost-intensive and time-consuming tasks.
Opportunities for broadening and deepening LCA
IOA as a macro-level approach has opportunities for broadening to life cycle approaches at national or international level, in the rigour of tracking back physical flows through economic accounting. IOA is already being used at EU-level and gives the opportunity to study where in a complex system a certain economic instrument will have most effect, and thus help design suitable policy instruments that will have impact on the desired flow/substance/target. EU research strategy can take advantage of IOA (and already has to some extent) in standardizing national accounts and constructing transparent EU-wide accounting tools where all material and economic flows can easily be tracked within the EU and possibly even globally. IOA is especially relevant for the knowledge gathering component of the Strategy on the Sustainable Use of Natural Resources used in Europe (TSURE) in tracking global (at EU-level) flows of resources.
Threats for broadening and deepening LCA
Handling EU-wide IO-tables requires relevant data-handling tools and competency of users. This may turn against the use of IOA, as the enormous amounts of data can make the tool less attractive and less transparent. With such development the tool may lose its robustness and reliability, especially if member countries do not provide the necessary data or the data cannot be validated.
Literature/Internet links
Leontief, W., 1986, Input-Output Economics, Oxford University Press.
European Commission, Eurostat home page, Data navigation tree for National Accounts, visited 12.02.2008. http://epp.eurostat.ec.europa.eu/portal/page?_pageid=1996,45323734&_dad=portal&_ schema=PORTAL&screen=welcomeref&open=/na/naio/naio_cp&language=en&pro duct=EU_MASTER_national_accounts&root=EU_MASTER_national_accounts&scrollto=0
European Commission, Eurostat home page, ESA 95 Supply, Use and Input-Output Tables, visited 13.02.2008. http://epp.eurostat.ec.europa.eu/portal/page?_pageid=2474,54156821,2474_54764840&_dad=portal&_schema=PORTAL
Finnveden, G., Moberg, Å., 2005, Environmental systems analysis tools – an overview, Journal of Cleaner Production 13, 1165-1173.
Keuning, S.J. & Ruijter, W.A. de: Guidelines to the construction of a social accounting matrix. Review of Income and Wealth 34:1 (1988), 71-100
Grêt-Regamey, A., Kytzia, S., 2007, Integrating the valuation of ecosystem services into the Input-Output economics of an Alpine region, Ecological Economics 63, pp. 786- 798.
Machado, G., Schaeffer, R., Worrell, E., 2001, Energy and carbon embodied in the international trade of Brazil: an input-output approach, Ecological Economics, Volume 39, Issue 3, pp 409-424.
Pietroforte, R., Bon, R., Gregori, T., 2000, Regional development and construction in Italy: an input-outout analysis, 1959-1992, Construction Management and Economics, Volume 18, Issue 2, pp 151-159.
Tia, W., Suksuntornsiri, P., Limmeechokchai, B., 2006, Macro-economic Assessment of Policy on Promotion of NGV in Thailand: An Energy Input-output Analysis, The 2nd Joint International Conference on “Sustainable Energy and Environment (SEE 2006)”, Bangkok, Thailand.
Wing I. S., Computable General Equilibrium Models and Their Use in Economy-Wide Policy Analysis: Everything You Ever Wanted to Know (But Were Afraid to Ask), Center for Energy & Environmental Studies and Department of Geography & Environment, Boston University, and Joint Program on the Science & Policy of Global Change, Massachusetts Institute of Technology.